Now that we’re all back into the swing of things, we thought we could give you an update of the top 10 growing and shrinking licensees from the end of last year. Movements show that, consistent with the first three quarters of the year, the vast majority of advisers are heading to privately owned licensees, and most of the licensees that are shedding the most advisers are in the institutionally owned and aligned sector.
Q4 of 2019 proved to be the second most fluid quarter in terms of adviser movements for 2019, with 1,325 advisers ceasing their authorisation and 839 advisers switching into different licenses during the quarter. Q4 saw 240 advisers return to the industry after starting the quarter as ceased – many of these have simply been “offline” during a transition from one licensee to another.
Although the 839 advisers who switched into new licensees in Q4 was 31% down on the year high of 1,218 switchers in Q3, it still represented a more dynamic movement than Q1 (560) and Q2 (715). Once again, advisers’ movements between institutional, aligned and private licensees has remained remarkably similar to the preceding three quarters of 2019 – particularly in terms of advisers switching into private licensees and switching out of the institutionally owned and aligned space. Over 73% of all switching advisers went to privately owned licensees in Q4 2019.
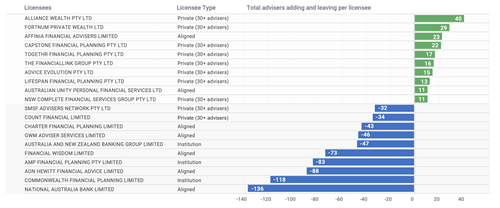
At a granular level, the licensees adding and shedding the most advisers in Q4 tells a similar tale to the first three quarters of the year. Our Chart shows this continued trend of large institutionally owned / aligned licensees contributing the majority of departures, while the larger privately-owned licensees are onboarding most new advisers.
Once again, the vast majority of licensees growing are privately owned, while the majority of licensees shedding advisers (including NAB, Commonwealth Financial Planning and AMP) are in the institutionally owned and aligned segments.
In terms of the statistics, there are 700 advisers represented in the top 10 firms shedding, and just shy of 200 advisers represented in the top 10 firms accepting.
The discrepancy between the magnitude of the totals for additions (197) and subtractions (700) in this top 10 list again points to the continued fragmentation of the licensee market – something we’ve seen repeated throughout 2019.Aside from this structural consistency regarding the numbers and types (private or otherwise) of licensees in each group, Q4 may provide some clues as to the much-anticipated direction that licensee business models may take, following the capitulation of the bank-owned vertically integrated distribution model.
We’ll keep an eye on those firm continuing to grow and examine what they have in common versus those that are downsizing in our upcoming Musical Chairs reports for 2020.
Article by:

Comments4
"Does the data take into account institutions ie NAB shedding their wealth management arms ie MLC aligned licensees? "
Tracy Phillips 21:27 on 04 Mar 20
"wow I can not believe Private Licencees are still a thing. How does a private licencee have time, let alone expertise to choose an approved list. I recall horrors such as Agri businesses, Property securities crash, Many cases of direct share playing, Storm FP. Man the list goes on. Give me an aligned or bank licencee any day. At least a bank will be there to deal with the fallout and they wont get caught up in fashionable, funny money ideas. If the shit hits the fan, all the others run away! An institution might look a little worse for wear but you will be able to find them. "
Greg Hearn 20:15 on 04 Mar 20
"Interesting data and article. I had to magnify the page to 400+% and then squint to read the very low resolution graph. Could you make that more accessible?"
Chris 14:47 on 04 Mar 20
"Thanks for this Adviser Ratings. Always interesting to read and looking forward to more analysis on the industry this year."
James D 14:23 on 04 Mar 20