With the release of our Q4 2019 Musical Chairs report into adviser movements in the financial advice industry, we also thought it might be interesting to look at some of the trends for the entire year. Overall 2019 was a massive year for movements in the industry. Although the entire year saw only 38 new advisers added to the adviser pool, there were over 5,000 adviser cessations registered during the course of the year and over 3,300 advisers switched licensees throughout the year. Analysis of these gross numbers indicate that around 30% of the entire industry has been on the move – in some form or another in 2019. Did someone say the industry was in flux?!?!
Industry Overview
Our year-end analysis of adviser numbers indicates a continuation of two key trends.
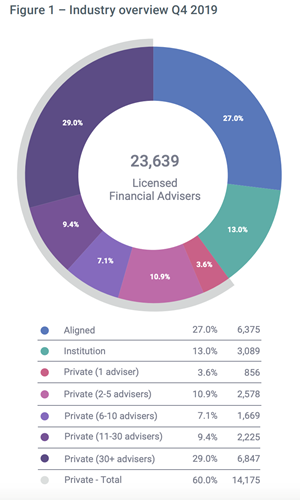
a) Overall adviser numbers have declined again in Q4, registering a drop of 4.6% (1,133 advisers). There are now 23,639 advisers which is the lowest overall number of advisers the industry has seen since December 2015. 2019 saw the industry shed a huge 4,378 advisers (15.6%) throughout the year.
b) The trend of increasing numbers of advisers being licensed by a privately-owned licensee continues. Privately licensed advisers as a percentage of all advisers rose from 57.8% to 60% in Q4.
Figure 1 shows the Q4 breakdown of advisers according to licensee type, with the private licensees also segmented by size. Once again, all the segments of the private licensee market have grown in percentage terms, except the 11-30 adviser group, which has slightly decreased from 9.6 to 9.4 percent of the entire market.
Continued Growth Of Private Licensees
Looking closer at our segmented groups of advisers, the majority of advisers were shed from the institutionally aligned adviser segment, which lost 665 advisers (9.4%), decreasing from 28.4 to 27.0 percent of the total market. The loss was mirrored in the institutionally owned space, which had a net loss of 320 advisers (9.4%), shrinking from 3,409 to 3,089 advisers. Institutionally owned advisers now make up only 13% of the entire adviser market.
We also note a growth in the “micro-licensee” segment. Advisers licensed by small privately-owned licensees of 10 advisers or less, grew both in terms of total numbers (from 5,040 to 5,103) and proportion of the market (20.4% to 21.6%). The other private licensee segments remain relatively static in terms of changes to adviser numbers, but the decrease in total industry adviser numbers meant that, effectively, most of their market share segments increased.
Annual Changes
With the industry as a whole shedding 4,378 advisers from its peak at the beginning of January 2019, the total number of advisers in each of our three broad segments has fallen this year. The annual change of adviser numbers from Dec 2018 to Dec 2019 indicates the institutional space has fallen by 1,229 from 4,318 to 3,089 (28.5%). In the same period, the aligned space has shed 1,958 advisers, going from 8,333 to 6,375 (23.5%). Number of advisers in privately owned licensees have also fallen by 1,191, from 15,366 to 14,175 (7.8%).
This inexorable across-the-board decline is being driven by a perfect storm of factors including the major banks exiting wealth, removal or reduction of commissions, higher educational standards, and the challenges for many to restructure their advice businesses to remain profitable in this new “professional” environment.
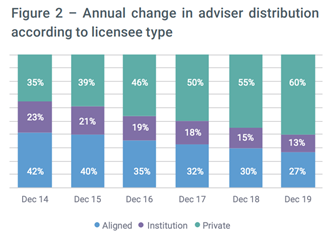
The smaller decline in the private space means that while total adviser numbers have been reduced, the proportion of total advisers in the private sector has continued its upward trend. The proportion of advisers from privately owned licensees has increased by over 5% this year alone, from 54.9% at the end of the Q1 2019 to fully 60% by the end of the year. The number of privately licensed advisers is now at its highest level in the last six years, as can be seen in Figure 2.
Six years ago, in 2014, the largest segment of advisers was in the aligned space, which made up 42% of all advisers. Since then aligned advisers have shrunk to 27% of the advice market. Institutional advisers made up 23% of all advisers in 2014, compared to just 13% now. This time period has seen the dramatic rise in the proportion of privately licensed advisers, going from 35% of the market to 60% today.
To view other Musical Chairs reports and see different analysis we have available, visit the Adviser Ratings pro-site here
Article by:

Comments1
"There has been much comment about the turmoil that the Financial Planning Industry faces. It seems that the narrative Australia lives by today, is that constant change is good and the pursuit of the perfect advice model is the only consideration. Like most things in life, the obvious question is rarely heard above the clamor of noise from vested interest groups and intellectual theorists who quickly cry wolf, yet rarely have a solution. Australians are mostly financially illiterate, so the need for basic budgeting and cash flow planning, as a first step in the holistic advice model, is a priority. Yet the very thing the Government has set in play to improve the lot of all Australians, has in actual fact, done the exact opposite. The only beneficiaries of all this chaos, apart from the lawyers, auditors and compliance entities, will be the top 20 percent of Australians with existing substantial earnings, assets and Investments. This leaves 80 percent of Australians who will have little chance of improving their lives. 23,639 advisers divided by 15 million Australians who need advice, equates to 634 clients per adviser, which is not feasible and with the huge work / compliance load and financial burden faced by practice owners per client today, it is little wonder the numbers of advisers and clients per adviser are dropping. This Government has failed to fix what were relatively easy issues to remedy. What the Government has done well, is to create a wasteland of opportunity lost, solutions that destroy incentives to grow and to build an army of leeches that are sucking the lifeblood out of small to medium Businesses."
Jeremy Wright 16:19 on 19 Feb 20